
Hundreds of calls happen on your floor every day, and most managers only see a fraction of them. Tracking the right call center agent performance metrics is what separates teams that grow quota from teams that wonder why they aren't.
What are call center agent performance metrics?
Call center agent performance metrics are KPIs that measure how effectively agents handle customer interactions.
They go beyond a simple count of calls handled. The right metrics give you a view into how well reps resolve issues, how efficiently they manage their time, where deals are being lost, and where coaching time should actually go.
For high-volume B2C inside sales teams, these numbers are the difference between guessing and knowing.
Why these metrics matter
Most managers still spot-check a handful of calls each week, but on a team of 50 or more reps, that only captures a small slice of what is really happening. As a result, most performance gaps go unnoticed and reps miss out on the kind of clear, actionable feedback that actually drives improvement.
Now that AI can evaluate 100% of calls, these metrics tell a complete and reliable story. Instead of guessing from samples, you can see exactly what’s working, what’s not, and where every rep needs to improve.
The three types of call center agent performance metrics
Call center metrics fall into three categories. Each one measures a different dimension of agent performance.
📂 Category | 📏 What it measures | 📊 Example metrics |
Customer experience | How customers feel about interactions with your agents | FCR, CSAT, NPS, CES |
Agent performance | How efficiently and effectively individual reps work | AHT, utilization rate, QA scores, transfer rate |
Operations | How the call center performs as a whole over time | Call arrival rate, cost per call, service level, occupancy rate |
All three categories connect back to agent performance.
A low CSAT score reflects how an agent handled an interaction. A high cost per call often traces back to long handle times or repeat contacts.
The categories just help you understand which lens you're looking through.
Customer experience metrics
These metrics measure how agents affect the customer on the other end of the call.
First call resolution (FCR)
First call resolution (FCR) measures the percentage of calls where the agent fully resolves the customer's issue on the first attempt, without a transfer, escalation, or follow-up call.
Many call center leaders consider FCR the single most important KPI to track. A high FCR means reps handle objections, answer questions, and move customers to a decision on the spot. When FCR drops, deals slip through.
Two ways to calculate it:
Total calls resolved on first attempt / Total calls received
Total calls resolved on first attempt / Total first calls only (excludes repeat calls)
The second formula gives a more accurate read on true first-call performance. Choose one approach and apply it across the whole team.
How to improve it: Review calls where resolution failed on first contact. Look for patterns in where reps lose control of the conversation. That's where coaching should focus.
Customer satisfaction score (CSAT)
Customer satisfaction score (CSAT) measures how satisfied customers are with a specific interaction, typically gathered through a post-call survey.
Formula:
(Total positive responses / Total responses) × 100
In a sales environment, CSAT reflects how customers felt about the conversation with your rep. A rep can close a sale and still leave a customer feeling pressured or confused. CSAT catches that.
How to improve it: Empower reps to resolve issues fully on first contact and to communicate with clarity and confidence throughout the call.
Net promoter score (NPS)
Net promoter score (NPS) measures customer loyalty by asking a single question: "How likely are you to recommend us to a friend or colleague?" Customers respond on a 0 to 10 scale.
Promoters: 9 to 10
Passives: 7 to 8
Detractors: 0 to 6
Formula:
% of Promoters - % of Detractors
NPS gives a long-term view of customer sentiment. In high-volume B2C sales, a low NPS often reflects patterns in how reps are handling the conversation, not just product issues.
Customer Effort Score (CES)
Customer effort score (CES) measures how much effort a customer had to put in to resolve their issue or complete a transaction.
A high CES means customers are working too hard to get what they need. In sales, that friction leads to abandoned calls and lost deals.
CES is typically measured on a five or seven-point scale, from "very low effort" to "very high effort."
Formula:
% who agree (low effort) - % who disagree (high effort)
How to improve it: Simplify call routing, reduce unnecessary transfers, and give reps the information they need to answer questions on the first call.
First response time (FRT)
First response time (FRT) measures how long a customer waits before connecting with an agent.
Formula:
Total wait time for all inquiries / Total inquiries
FRT is distinct from Average Speed of Answer (ASA). FRT looks at the total time from contact initiation. ASA measures time in the queue specifically.
A high FRT in a sales environment means customers are reaching competitors before they reach your team.
Agent performance metrics
These metrics measure how effectively individual reps handle their workload and interactions.
Average handle time (AHT)
Average handle time (AHT) is the total time an agent spends on an interaction, including talk time, hold time, and wrap-up work.
Formula:
(Total talk time + Total hold time + Total wrap-up time) / Total calls
AHT is useful for spotting outliers. A rep far above the team average might be struggling with objections. A rep well below it might be rushing through calls and not resolving the customer's concern.
The common mistake is using AHT as a productivity proxy without checking quality alongside it. Pair AHT with FCR and repeat call rate to get the real picture.
Wrap-up time (after-call work)
Wrap-up time, also called after-call work (ACW), is the time agents spend completing tasks after a call ends. This includes logging notes, updating records, and scheduling follow-ups.
Formula:
(Total handle time - Total hold time - Total talk time) / Total calls
Long wrap-up times cut into how many calls a rep can handle per shift. They often signal that post-call processes could be automated.
How to improve it: Automate routine logging tasks and give reps templates for common call outcomes.
Call abandonment rate
Call abandonment rate is the percentage of inbound callers who hang up before an agent picks up.
Formula:
(Calls received - Calls handled) / Calls received × 100
An abandonment rate above 5-8% is a signal that something is off. Most teams exclude calls abandoned in the first five seconds, since those are typically wrong numbers.
Why it matters for sales: Every abandoned call is a potential sale lost before the conversation starts. Offering a callback option is one way to reduce the rate without adding headcount.
Total resolution time
Total resolution time measures the time it takes to fully resolve a customer's issue from the first point of contact through to final close.
This is different from AHT. AHT covers the call itself. Total resolution time captures everything, including follow-up calls, escalations, and any additional steps needed to close the issue.
Formula:
Total time of all resolved interactions / Total tickets resolved
In sales, a high total resolution time means customers are waiting too long for answers. That lag kills momentum and close rates.
Transfer rate
Transfer rate is the percentage of calls moved to another agent or department after initial pickup.
Formula:
Calls transferred / Total calls handled × 100
High transfer rates frustrate customers and signal training gaps. When reps can't handle common objections on their own, the conversation loses momentum and the customer loses confidence.
Look for patterns in transfer reasons. If reps are consistently transferring on the same question, that's a playbook gap, not a routing problem.
Agent utilization rate
Agent utilization rate measures the percentage of time agents spend handling calls versus sitting idle.
Formula:
(Average calls handled × Average handle time) / Total work hours × 100
A high rate means your team is engaged and productive. Pushing it too high over time leads to burnout, which drives turnover in already high-pressure inside sales environments.
The goal is a rate that keeps output strong while leaving enough room for reps to stay sharp.
Occupancy rate
Occupancy rate measures the percentage of time agents are occupied with call-related activities, including talk time, hold time, after-call work, and any related tasks.
This is distinct from utilization rate. Utilization measures time relative to total paid hours. Occupancy measures time relative to time logged in and available.
A high occupancy rate means agents are consistently engaged. Excessively high rates, however, lead to fatigue and errors. The goal is a balance that keeps quality high.
Adherence to schedule
Adherence to schedule tracks how closely agents stick to their assigned shifts and break schedules.
Formula:
(Handling time + Available time) / Paid hours × 100
On a team of 50 or more reps, even a few agents off-schedule creates real gaps in coverage. Missed calls and longer wait times ripple across the whole floor. Many teams target an adherence rate between 85% and 95%.
Calls answered per hour
Calls answered per hour measures how many calls each agent handles within an hour.
Formula:
Calls answered / (Total available time - Idle time)
This is a useful productivity benchmark, but it should never be the primary measure of rep performance. A rep handling the most calls per hour might be cutting conversations short and missing close opportunities.
Pair this with FCR and repeat call rate to understand whether volume is coming with or at the cost of quality.
Average speed of answer (ASA)
Average speed of answer (ASA) measures how long, on average, a caller waits in the queue before an agent picks up.
Formula:
Total wait time for answered calls / Total calls answered
A high ASA in a high-volume sales environment means customers are reaching competitors before they reach your team. ASA and service level should be reviewed together.
Average hold time (in-call)
In-call hold time measures how long customers spend on hold while already speaking with an agent, typically while the rep checks information or speaks with a supervisor.
Formula:
Total seconds on hold / Total calls
Long in-call hold times frustrate customers and signal that reps lack either the information or the confidence to handle the situation on their own. Both are coaching issues.
Agent effort score (AES)
Agent effort score (AES) measures how easy or difficult it is for agents to support customers and do their day-to-day jobs.
AES is the only call center metric that captures performance from the agent's perspective. A high AES means agents are facing friction in their workflows. That friction leads to longer handle times, more transfers, and eventually burnout.
Formula:
Sum of agent survey scores / Number of respondents
How to improve it: Gather regular agent feedback to identify workflow bottlenecks. Common culprits are poor system integrations, unclear playbooks, and insufficient access to customer information during calls.
Missed and declined calls
Missed and declined calls tracks the number of incoming calls that an agent doesn't answer, whether they're unavailable, on another call, or declining.
This metric identifies specific times when demand exceeds agent availability. Use it to adjust staffing levels and call routing during peak windows.
Call availability
Call availability refers to the percentage of time agents are available to take calls versus occupied with another call or non-call tasks.
High call availability means agents are accessible and customers aren't waiting. Low availability means agents are spending too much time on administrative tasks, or the team is understaffed for current call volume.
QA scores
QA scores evaluate how well agents follow coaching standards, compliance requirements, and call protocols during interactions.
For Medicare and insurance teams, QA has a compliance dimension alongside performance. Every call needs to be graded against both.
The problem with manual QA is coverage. Managers reviewing a few calls per week miss the majority of what's happening. Automated QA covers 100% of calls, which means patterns surface faster and coaching stays connected to real behavior.
Call center operations metrics
These metrics give leadership a big-picture view of how the call center is performing over time.
Service level
Service level measures the percentage of calls answered within a defined time window. A common target is 80% of calls answered within 20 seconds.
Formula:
Calls answered within threshold / Total calls offered × 100
This metric shows whether your team has the capacity to match incoming call volume. When service level drops, sales opportunities walk away before a rep ever gets on the line.
Call arrival rate
Call arrival rate measures how many incoming calls the call center receives within a set time frame. Operational managers watch this daily, and executives look at trends over time.
Formula:
Number of incoming calls in a specific time frame
Tracking call arrival rate helps you anticipate peak periods, align staffing, and prepare the team for high-volume windows. A mismatch between call arrival rate and staffing leads directly to higher abandonment rates and lower service levels.
Active waiting calls
Active waiting calls shows the number of customers currently in the queue at any given moment.
This is a real-time metric. Managers use it to pivot quickly during unexpected volume spikes, whether that means reallocating agents, adjusting routing, or activating a callback option.
Keeping this number low prevents long wait times from building up and turning into abandoned calls.
Average age of query
Average age of query measures how long unresolved issues stay open from the time they're created to the time they're closed.
Formula:
Total days or hours of open queries / Total number of open queries
In sales environments, a high average age of query means customers are waiting too long for answers after the first call. That lag creates re-contact, frustration, and lost deals.
Calls handled
Calls handled is the total number of calls an agent or team successfully closes within a given period. This typically excludes abandoned calls.
Many teams break this down into:
Total calls handled by an agent
Total calls handled by an IVR system
Calls handled is a workload and capacity metric. Use it alongside quality metrics to make sure volume isn't coming at the cost of performance.
Repeat call rate
Repeat call rate is the percentage of customers who call back about the same issue within a set time window.
Formula:
Calls related to a repeated issue / Total calls × 100
A high repeat call rate means the first conversation didn't resolve the customer's concern. In sales, that means the deal didn't close, and now you're spending more time and resources on the same customer.
Repeat call rate is one of the clearest coaching signals you have. It shows exactly where reps leave issues unresolved and which issues come up most often.
Cost per call (CPC)
Cost per call (CPC) is the average cost of handling each customer interaction.
Formula:
Total cost of all calls / Total calls
Tracking CPC over time helps sales leaders see where inefficiencies are eating into margins. High repeat call rates, long AHTs, and unnecessary transfers all inflate cost per call. Each of those is also a coaching opportunity.
Percentage of calls blocked
Percentage of calls blocked measures how many incoming calls couldn't connect because all lines were occupied.
Formula:
Calls that did not reach agents / Total incoming calls × 100
A high call blocking rate means your contact center doesn't have the resources to handle current call volume. In a sales environment, blocked calls are deals that never even started.
Callback rate
Callback rate measures the percentage of customers who choose a callback rather than waiting on hold.
A high callback rate signals that customers trust the option and find it convenient. A low rate might mean the feature isn't being communicated clearly enough in the IVR.
Tracking callback rate helps you understand how much of your inbound volume can be shifted out of the live queue, which reduces pressure on agents during peak periods.
Longest hold time rate
Longest hold time captures the maximum time any single customer spent waiting for an agent in a given period.
This metric surfaces the worst-case customer experience on any given day. Tracking it consistently helps teams set internal standards and identify when staffing falls short during peak windows.
Peak hour traffic
Peak hour traffic identifies the time windows when call volume is highest.
Tracking peak hours helps align staffing with demand. When peak periods are understaffed, service level drops, abandonment rate climbs, and sales opportunities fall through.
Call center metrics that mislead without context
Some of the most common call center agent performance metrics can be misleading when you look at them on their own.
Take average handle time. A low AHT might make a rep look efficient, but if their first call resolution is low and their repeat call rate is high, they’re rushing through calls and creating more problems later.
The same goes for calls per hour. High volume can look productive at first glance, but if that rep’s close rate is well below the team average, those extra calls are not turning into real results.
The key takeaway is simple: No single metric tells the full story.
To get a clear view of performance, you need to connect efficiency metrics like AHT and calls per hour with quality metrics like FCR, repeat call rate, and QA scores. That is where real insights live, and where meaningful coaching begins.
10 strategies to improve call center agent performance
Tracking metrics is only useful if they lead to action. The real impact comes from how you use those insights to coach reps, fix gaps, and improve performance across the floor.
Here are 10 practical ways to turn your metrics into measurable results:
1. Invest in agent engagement
Engaged agents are more productive and deliver better customer interactions. Recognize top performers, create clear growth paths, and keep communication open. Engaged reps bring down AHT, improve FCR, and stay longer.
2. Build a knowledge base reps can use on calls
When reps can quickly find accurate information during a call, AHT drops and FCR improves. Keep it updated with the latest product details, objection responses, and compliance requirements.
3. Align staffing with call volume patterns
Use historical call arrival rate data to forecast peak periods. Understaffing during high-volume windows drives abandonment rate, service level failures, and lost sales.
4. Monitor for signs of stress and burnout
High occupancy rates over time lead to errors, turnover, and declining performance. The standard call center occupancy rate sits between 75% and 85%. Once it rises above 85%, agent burnout risk increases, and rates above 90% are widely considered unsustainable.
When agents are operating at that level for too long, the impact shows up quickly in performance. Watch for early warning signs like spikes in absenteeism or drops in QA scores before results start to slip.
5. Give reps self-service access to their own performance data
Agents who can see their own KPIs are more motivated to improve. Build dashboards that show individual metrics clearly, without requiring a manager to interpret them.
6. Add self-service options to reduce call volume pressure
IVR systems and callback options reduce the strain on agents during peak periods. This lets reps focus on complex conversations instead of routine inquiries.
7. Monitor performance across 100% of calls
Manual QA covers a fraction of what's happening on the floor. Automated QA gives you full coverage, which means patterns surface faster and coaching stays grounded in real behavior.
8. Personalize coaching to each rep's gaps
Generic training doesn't change behavior. When coaching is tied to specific call moments where a rep lost control of a conversation, it sticks. Metrics like FCR, transfer rate, and repeat call rate show you where to look.
9. Tie performance goals to revenue outcomes, not just efficiency
Reps who understand how their metrics connect to close rates and quota are more motivated to improve than those chasing abstract KPI targets.
10. Support feedback and coaching with AI
AI-powered QA tools evaluate every interaction and deliver targeted, consistent feedback at scale. This removes the time burden from managers and ensures every rep gets meaningful, consistent feedback instead of relying on limited spot checks.
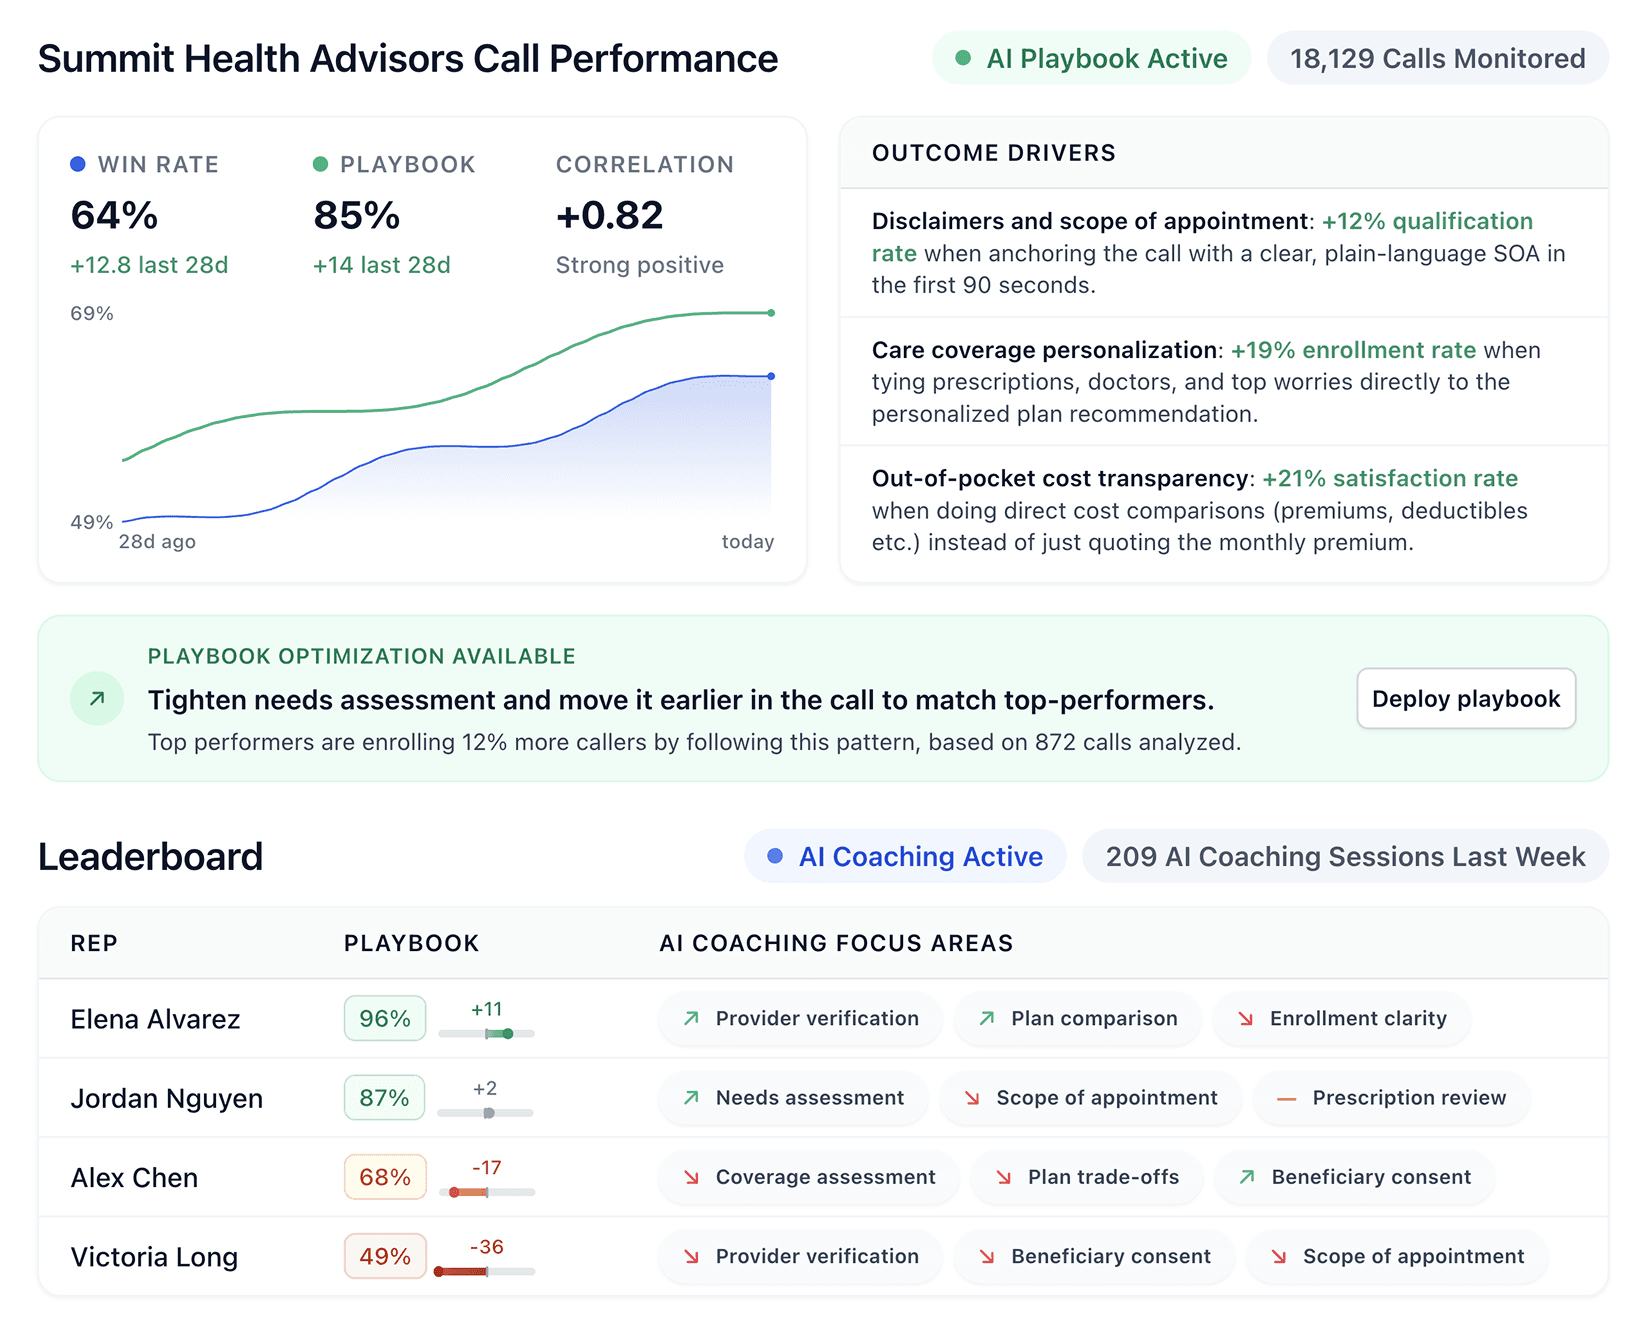
How Alpharun connects metrics to real coaching at scale
Seeing a problem in your metrics is step one. Fixing it across 50, 100, or 150 reps is where most teams get stuck.
Alpharun analyzes thousands of calls from your top performers to identify the specific behaviors that drive conversions. Those insights are then turned into a custom playbook built from what is already working inside your team.
How Alpharun supports coaching and performance:
Standardizes coaching at scale by guiding every rep against a proven playbook, down to the exact moment in a call where things went off track and what to say instead
Helps managers focus their time with a weekly digest that shows who is performing well and where coaching is needed most
Reduces the daily feedback workload by sending short, targeted coaching notes directly to agents
Automates QA scoring so performance and compliance are tracked in one place
Ensures compliance by building required checks into the scoring model, especially for Medicare and insurance teams
It’s also SOC 2 Type 2 compliant, which is important if you are operating in regulated B2C industries.
And if you are thinking about integrating it into your existing setup, it connects easily with platforms like Five9 and Genesys, with onboarding typically taking about a week.
If you want to see how this could work for your team, book a quick demo with Alpharun.
Frequently asked questions
What is the most important call center KPI for sales teams?
First call resolution (FCR) is the most important KPI for sales teams because it shows if reps solve issues and move deals forward on the first call. Low FCR often leads to lost deals and more repeat calls.
What is the difference between occupancy rate and utilization rate?
The main difference between occupancy rate and utilization rate is how time is measured. Occupancy rate tracks time spent on call-related tasks while agents are available, while utilization rate tracks productive time out of total paid hours.
How often should managers review call center metrics?
Managers should review service level, ASA, and abandonment rate daily, core performance metrics weekly, and cost or trend metrics monthly. This schedule helps teams react quickly while still tracking long-term performance.
Why is manual QA not enough for large sales teams?
Manual QA is not enough for large sales teams because it only reviews a small sample of calls. Automated QA analyzes all calls, which helps teams find patterns faster and improve coaching.
What is agent effort score (AES) and why does it matter?
Agent effort score (AES) measures how easy agents find their daily work. A high AES shows friction in systems or workflows, which can slow performance and hurt retention.