
Most call center managers put their target agent utilization at "around 85%." Fewer agree on how high is too high.
The call center agent utilization benchmark has a floor everyone can recite and a ceiling almost nobody respects. A team that runs too cold pays reps to sit idle, while one that runs too hot trades tomorrow's call quality, plus a few of your best closers, for a better-looking dashboard today.
Here's where the healthy band actually sits, how to work out your own number, and how to push utilization up without setting the floor on fire.
Call center agent utilization benchmarks at a glance
Metric | Needs improvement | Healthy band | Top performer |
|---|---|---|---|
Agent utilization | under 60% | 75–85% | Up to 85%, held steady |
Schedule adherence | under 80% | 85–90% | over 93% |
Occupancy | under 75% | 75–85% | ~85% ceiling (sustained) |
Utilization and schedule adherence tiers adapted from NectarDesk's benchmark table; the occupancy band per SQM Group, the 85% ceiling per Call Centre Helper, and the 85–90% adherence target per Call Centre Helper.
Most managers read a table like this top to bottom, hunting for the highest number they can hit. The healthy targets sit in the middle column. Many published benchmarks, like NectarDesk's call center benchmarks, put healthy agent utilization at 75% to 85%, and SQM Group sets the industry standard for occupancy in that same band.
Occupancy is the one row where a higher number can be the worse sign. Call Centre Helper warns that burnout sets in once occupancy runs above 85% for long stretches, so treat 85% as a ceiling and read anything above it as a flag.
Published utilization benchmarks don't all use the same math. WFM Labs defines utilization as handle time ÷ total paid hours, with a common target of 65% to 75%, while some vendor guides, like HiveDesk's, divide by logged-in time and report higher numbers. Check which denominator a benchmark uses before you compare it with your own.
These are cross-industry averages. Your real target shifts with your vertical and your season, as the industry section below shows. If you want the wider dashboard that these sit inside, start with our guide to call center performance management.
What is agent utilization (and how to calculate it)
Agent utilization is the share of paid time a rep actually spends handling interactions. That includes talk time, hold, and after-call work like notes and dispositions. It leaves out breaks, training, team meetings, and idle time between calls.
The formula is simple:
Agent utilization = (time spent handling interactions ÷ total paid time) × 100
Here's a worked example. Say a rep is paid for a 40-hour week and spends 32 of those hours handling calls and wrapping them up. That's 32 ÷ 40 × 100, or 80% utilization. That's inside the 75% to 85% band most published benchmarks use, though above WFM Labs' 65% to 75% target for paid-time utilization.
One pro tip that saves a lot of arguments later: pick your denominator and stick with it. Some teams divide by total paid hours; others by scheduled or logged hours, and the two produce different numbers for the same rep. Neither is wrong. Mixing them across reports is how you end up "improving" utilization without anyone changing a thing.
Agent utilization vs occupancy: What's the difference?
These two are used as synonyms constantly, and they measure different things.
Agent utilization looks at the whole paid day. It asks what fraction of the time you're paying for turns into handled contacts, so it captures shrinkage like meetings, coaching, and training.
Occupancy looks only at available productive time. Occupancy = handle time ÷ (handle time + available idle time) × 100. It asks how busy agents are while they're logged in and ready to take work, and it ignores the hours they spend off the queue in a 1:1 or a training session.
So utilization is your cost and capacity lens: it tells you how efficiently the schedule converts paid hours into customer work. Occupancy is your intraday staffing lens: it tells you whether the queue is drowning your available reps or leaving them waiting.
Track occupancy when you're tuning staffing and queue health throughout the day. Track utilization when you're planning capacity, budgeting headcount, and auditing how much of the schedule is real selling time. Both sit inside broader workforce optimization, and the workforce team usually owns the balance between them.
What's the ideal agent utilization range (and why too high backfires)
The healthy band is 75% to 85%, and both edges are failures for different reasons.
Below 75%, you're carrying idle capacity. Reps are logged in with gaps that the schedule can't fill, and you're paying full price for partial selling time.
Above 85%, you start borrowing against your own team. Sustained occupancy near 90% tends to push average handle time up and drive burnout and attrition, which is why contact center managers polled by Call Centre Helper warn against running above 85% well before it reads as a win.
Call center turnover already runs high, with SQM Group putting the industry standard at 30% to 40% a year. Over-utilization pushes you toward the worse end of that range.
On a business-to-consumer (B2C) sales floor, the damage is concrete. A rep running at 95% occupancy answers slower, skips the discovery question that surfaces the real objection, rushes the disclosure that keeps you compliant, and lets a closeable deal walk because they're already three dials behind.
Treat utilization as an input you manage: chasing the ceiling costs more than the idle time it saves.
Agent utilization benchmarks by industry
The 75% to 85% band is the cross-industry default. Your own target drifts based on call complexity, compliance load, and how much after-call work each contact drags behind it.
Industry | Where utilization usually lands | Why it lands there |
|---|---|---|
Healthcare | Below the band | Complex calls, heavy after-call work and documentation |
Financial services & insurance | Inside the band | Required disclosures and verification add handling time |
Retail & e-commerce | Top of the band | Shorter, more transactional interactions |
Outbound BPO & telesales | Above the band | Predictive dialers compress the idle time between calls |
Treat these as directional ranges. They vary widely by operation and season.
On regulated phone floors like Medicare, life insurance, and mortgage, the compliance steps are the reason the band stays modest. Medicare advisors carry non-negotiable handling time on sales calls: the Scope of Appointment, the third-party marketing organization (TPMO) disclaimer for agents who sell for more than one plan, and the pre-enrollment checklist.
Life insurance and consumer-direct mortgage teams carry their own required disclosures and recording notices. That's real, required work, and squeezing it out to juice a utilization number is how compliance findings start.
Season matters, too. A Medicare team hitting 80% in July can run well above it during the Annual Enrollment Period from October 15 to December 7, the busiest stretch of the year for most Medicare floors. Plan the band around the calendar and staff up before occupancy does the planning for you.
Related KPIs to track alongside utilization
Utilization only makes sense next to the metrics it trades against. Improving one in isolation usually breaks another.
Average handle time (AHT): The lever you pull to free up capacity. Cutting it helps right up until reps start clipping steps to hit the number, so it pays to know the ways to reduce average handle time that keep the call intact.
First call resolution (FCR): The counterweight to AHT and utilization. A rushed call that fails FCR just books itself a callback, so your "efficient" day creates tomorrow's volume.
Schedule adherence: How closely reps follow their planned on-queue time. Weak adherence makes utilization look low even when staffing is right.
Occupancy: The intraday busyness read that tells you whether a high utilization number is healthy or a burnout risk in disguise.
The rule of thumb: never move utilization without watching FCR and quality assurance (QA) scores in the same view. The whole set of agent performance metrics is meant to be read together.
How to improve agent utilization without burning out your reps
Lifting utilization is mostly about removing waste from the schedule. Four levers do most of the work.
Forecast and schedule to real demand: When staffing matches call arrival patterns, you avoid the twin problems of idle reps in slow hours and drowning reps in peaks. Good staffing and scheduling practices are the main structural fix.
Cut after-call work: Wrap time is often one of the largest recoverable chunks of the day. Automating dispositions, CRM notes, and call summaries hands reps back minutes on every contact, and those minutes convert straight into selling time.
Protect shrinkage that earns its keep: Coaching, training, and breaks pull reps off the queue and drag utilization down on paper. Clawing that time back to hit a number is a false economy, because that's the time that makes every handled call better.
Coach the middle of your floor: Small, steady gains across most of your reps beat chasing your top performers for another point.
There's a guardrail on all of this. As utilization climbs, quality has to stay visible, or you're just speeding up mistakes. Manual QA can't keep up: a review team only ever hand-scores a small slice of calls, which leaves the busiest reps the least watched.
Full-coverage scoring closes that blind spot, so a rep skipping discovery or a missed disclosure surfaces the day it happens, long before an auditor finds it.
How Alpharun keeps quality visible as utilization rises
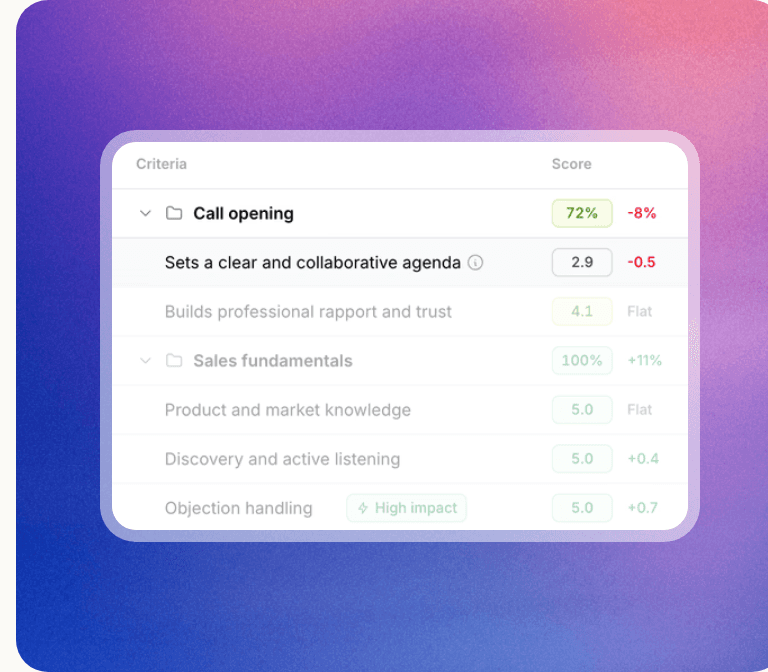
Alpharun's call scorecard, breaking a rep's call opening and sales fundamentals into scored criteria.
A higher utilization number is only real if the quality holds. At 88%, the reps who were cutting corners at 80% cut more corners, on more calls, with less of your attention to catch it.
Managers can't watch that by hand. On a floor of 50 reps, each taking dozens of calls a day, a hand-scored QA sample leaves almost every call unseen, and the ones that slip through are the rushed ones that over-utilization creates.
Alpharun sits on top of your existing call center stack and closes that gap. It builds a bespoke playbook from your own best calls, then grades every interaction against it, so the standard comes from your top advisors.
With Alpharun, call center teams can:
Score every call across sales execution, QA, and compliance, so quality stays visible as utilization climbs
Catch skipped discovery, rushed disclosures, or missed SOA and TPMO steps within minutes of the call ending
Give each rep sentence-level coaching on their own calls, delivered right after the call while the conversation is fresh
Surface which reps to coach and which calls to review before 1:1s, so the manager's time tracks where the pressure is
Pair human reps with AI voice agents that handle repetitive and after-hours calls that don't need a person
Used this way, utilization becomes the output of a floor that's both busy and good at the work. The kind of high-volume Medicare and life insurance teams Alpharun works with get the efficiency gain and keep the enrollment quality that pays for it.
Book a demo with Alpharun to see how your own calls score as you move toward a healthy call center agent utilization benchmark.
Frequently asked questions
What is a good utilization rate for a call center?
A good call center agent utilization rate sits between 75% and 85%. Anything below that range signals idle capacity and wasted payroll, while sustained readings above it risk agent burnout, rising handle time, and higher turnover.
What is the difference between utilization and occupancy?
Utilization measures handling time against total paid time, so it captures shrinkage like meetings and training. Occupancy measures handling time against available time only, so it shows how busy agents are while they're logged in and ready for work.
How do you calculate agent utilization?
Divide the time a rep spends handling interactions by their total paid time, then multiply by 100. A rep paid for 40 hours who handles calls for 32 of them is running at 80% utilization.
Is higher agent utilization always better?
No, higher utilization is not always better. Once a floor sustains occupancy in the high 80s or low 90s, customer satisfaction tends to drop, average handle time inflates from fatigue, and attrition climbs, so it pays to cap the healthy band at 85%.
What utilization benchmark should a regulated inside-sales team use?
Regulated teams in Medicare, life insurance, and consumer-direct mortgage should hold the 75% to 85% band. Required compliance steps like disclosures and Scope of Appointment add handling time that shouldn't be optimized away to hit a higher number.


